 communication partner
Statistical Estimation
The sample mean, as a point estimate, is a good estimator "if" it possesses the following:
- Sufficiency
- Efficiency
- Lack of Bias
- Consistency
Interval estimates are more helpful if they are associated with a level of confidence. An interval refers to the standard error of the mean, 1, 2 or 3 standard deviations is normally sufficient.
Below is the formula to construct a confidence interval.
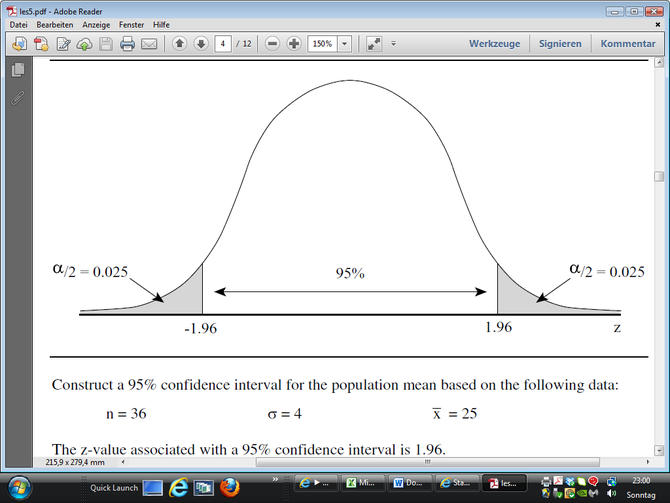
Z = 1,96 is 95% (alpha = 5%)
Z = 1,645 is 90% (alpha = 10%)
Z = 2,575 is 99% (alpha = 1%)
bzw 90% of the time, using this procedure, the interval will contain the population mean.

There are normal populations where the standard deviation is known, and normal populations where the standard deviation is not known (t-distribution) and taking a large sample. In the case of a non-normal population, a large sample is always taken.
Remember that due to the central limit theory, the larger the population, the arithmetic mean of a distribution of events approaches a normal population.
An important difference between a sample mean and a confidence interval is that one is a point estimate, the other a proportion. Both imply information about the real populatlion.
The symbol pi is used if the population proportion is known. It is a binomial parameter and using the formula n*pi (1-pi) > 3, represents a good sample size (since the confidence interval is sufficient).
Estimate of the Population Mean - Point Estimate
Required Sample (Sample Population size) = (confidence interval as a decimal..bzw 1,96)^2 * sigma (population standard deviation) / allowable error (raised to the power)^2
Estimate of the Population Proportion - Interval Estimates
Required Sample Size = (confidence interval of pi as a decimal..bzw 2,575)^2 *
Worst Case: (rejects/10)*(1-(rejects/10)) / 4 % of pi or (0,04)^2
Normal Case: (rejects)*(1-rejects) / 4 % of pi or (0,04)^2